Measurement - Starter Guide
This guide will assist you in becoming familiar with MAP's Measurement advertising performance analytic report suite.
This guide will assist you in becoming familiar with MAP's Campaign Measurement advertising analytic report suite.
App Selection Filter
An important part of any Measurement report run is the selection of the mobile device application that you wish to see data for. A mobile app must be selected to run a Measurement report.
App filter with no selections made.
To select an app click on the App Selection box. Once the App Selection box is clicked, an App Selection pop up window will present itself. This window is the main App Selection navigation area.
Mobile App AvailabilityOnly those mobile apps that are enabled within the MAP Org being used will appear for selection in the window. To gain access to more, or different, mobile apps, contact your Account Team for assistance.
At present there are 1,000+ apps available for Measurement reporting, with more being added everyday.
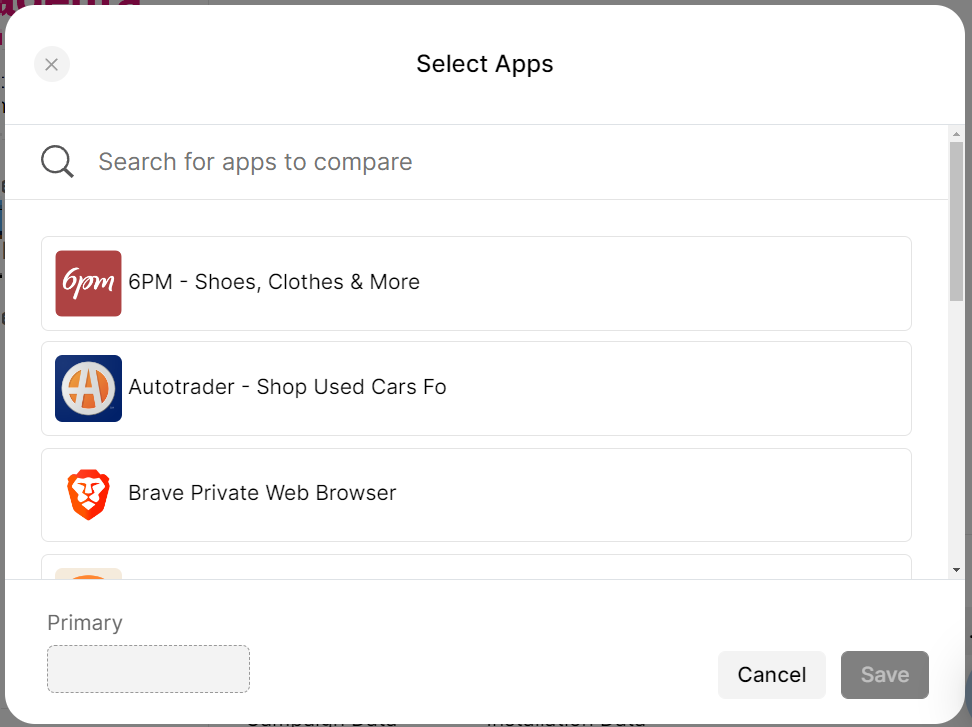
App Selection pop up window.
Once in the App Selection pop up window, there are two (2) ways to select the mobile app that should be included in the report run:
- Search for a mobile app.
- Scroll for a mobile app.
Search for a Mobile App
Using the magnifying glass search bar, type in the name of a mobile app that should be included in the report run. The app search functionality of Measurement is predictive based on app name, and will return results instantly as letters are typed. The more complete the entry, the more refined the results will be.
App Search Best PracticesAt present, app search results are only based upon the external facing name of the app as it would appear in an app store. Searching for apps based upon their genre, business vertical, or other metadata may not return applicable results.
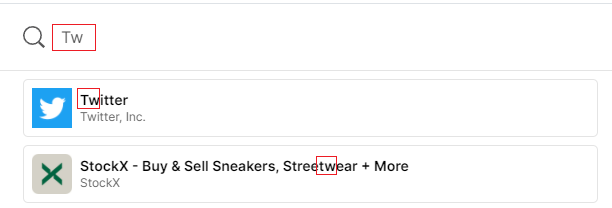
Predictive app search results.
Once the appropriate app appears, click on it to include it in the report run.

Twitter is selected for inclusion in the report run.
Scroll for a Mobile App
Deleting any entered text in the search bar will reveal all available mobile apps for selection again. Use the scroll bar to find mobile apps of interest. When an app of interest is found, click on that app icon or name to include it as an app in the report run.
To change an app when there is already an app selected, the currently selected app must first be removed. To remove the app, click on that app's icon in the lower left hand corner of the app selection window. Once the app icon is clicked, the space will change back to an empty square, and a new app can be selected for that space.

Removal of an app to enable the selection a different app in the App Selection window.
Once a mobile app is selected for the report run, click the "Save" button to close the App Selection pop up window.
Exiting the App Selection Modal WindowWhile in the App Selection window, clicking either the top left "X", or the bottom right "Cancel", icon / button will close the App Selection window without saving any changes.
Advertiser & Campaign Filters
The Advertiser and Campaign filters work in tandem to help narrow down the applicable campaigns associated to the MAP Organization that you are running the report in. This layer of data slicing is the most important in a Measurement report, as it controls which ad log data is utilized in the crafting of the report results.

Advertiser and Campaign filters with no selections made.
When deciding on which campaign to report on, there are two strategies to making a selection:
- Advertiser-First Approach
- Campaign-First Approach
Advertiser-First Approach
In the Advertiser-First approach, the Advertiser filter is utilized to narrow down the possible campaigns that can be reported on in the Measurement product. All Campaigns are associated to a single Advertiser in Measurement, so selecting from the list of available advertisers will narrow the available options in the Campaign filter to only those campaigns that are associated to that advertiser.
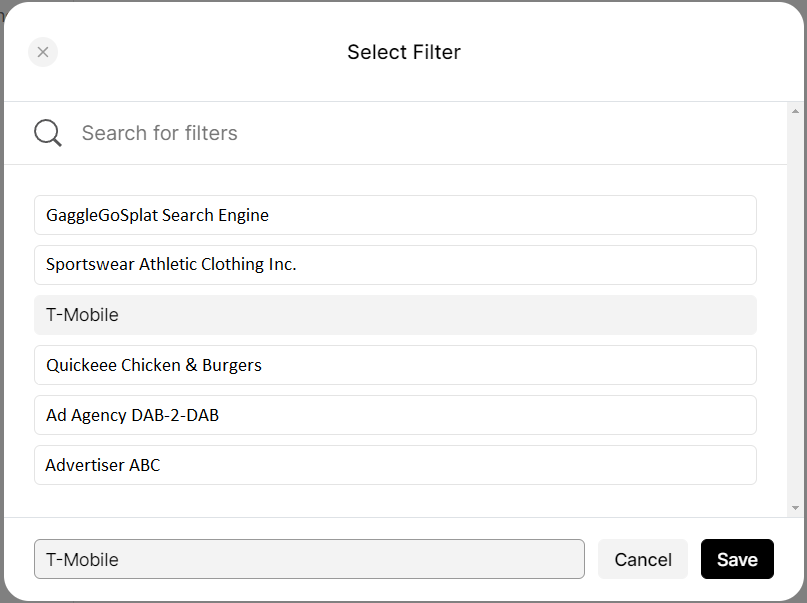
Advertiser selection pop up window with T-Mobile selected as the advertiser.
Once in the Advertiser selection pop up window, there are two (2) ways to select which advertiser should be included in the report run:
- Search for an advertiser.
- Scroll for an advertiser.
Advertiser Selection RestrictionsAt this time only one (1) advertiser can be selected per report run. Additionally, a report cannot be run if no advertiser is selected. If no advertiser is selected, the report's Run button will remain greyed out and no data can be returned.
Advertisers are available for selection in the Advertiser filter based on two (2) criteria:
The Advertiser name is created in the Campaigns > Advertisers section of the MAP platform for the Org that the user wishes to see that advertiser's data in.
The Advertiser, once created in Campaigns > Advertisers, is additionally linked to the correct DSP Advertiser ID in the MAP backend. Currently this linkage creation is only possible by members of the of your Account Team. Please contact one of the members of your account team for more information on updating, or changing, the advertiser associations in your MAP Org.
Campaign-First Approach
In the Campaign-First approach, the Campaign filter is utilized to find the correct campaign to report on from a list of ALL available campaigns that can be reported on, from across all advertisers available in the Org. In the "campaign-first approach" its best to know the details, or preferably name, of the campaign you wish to report on, as well as be willing to scroll across numerous campaign names to find the correct one.
Because all campaigns are associated to a single advertiser in Measurement, selecting a single campaign from the list of available campaigns will then auto-determine the correct associated advertiser to that campaign, and the auto-fill the Advertiser filter correctly.
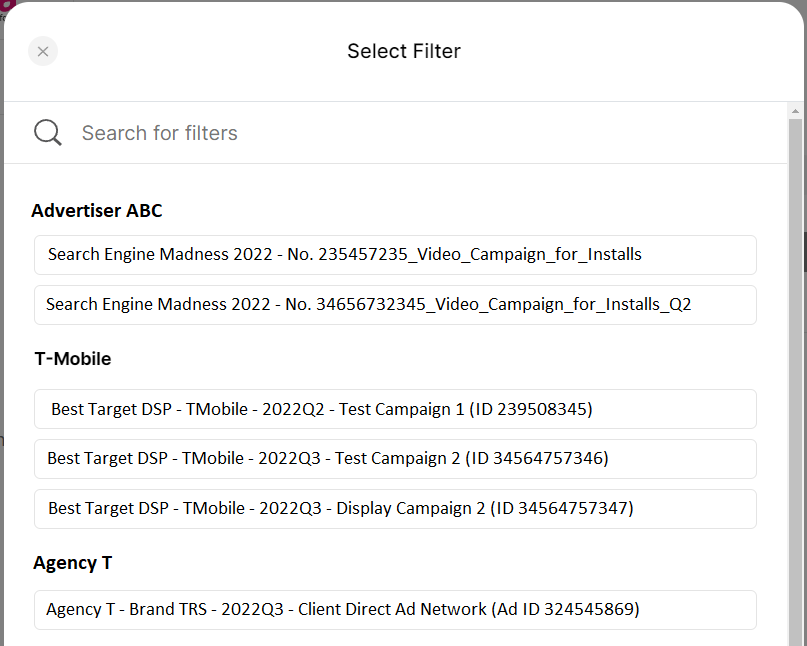
Campaign selection pop up window. Selecting from the available campaigns associated to the Org will autofill the Advertiser filter.
KPI Date Range & Impression Window Filters
The Measurement suite of analytic reports allow for customization of the KPI reporting date range, as well as the attribution window, when setting up a report. These filters are split into three (3) distinct pieces that work together to help intuitively decide what data to gather for the returning report results. These three (3) pieces are:
- Granularity
- KPI Date Range
- Window (Impression Window)
Granularity
The Granularity drop down works in conjunction with the KPI Date Range picker to help isolate the appropriate dates for which to return data in each report. The date grain is a preset choice between one of three options:
- Days
- Weeks
- Months
Most Measurement reports offer data as both an aggregate (sum or average as appropriate to the specific metric) for the date range, as well as a time series graph trend, in which the data is graphically plotted across daily, weekly or monthly data points.
Date Grain Application in the Report PageDate Grain selection specifically affects the data points of any Over Time (time series) graphs, as well as the corresponding Info Table(s).
However, when reviewing data in the Snapshot of any report page, its important to note that the Snapshot data is all aggregated or averaged (as appropriate) from only the daily data values. Changing date grains will have no affect on the Snapshot values.
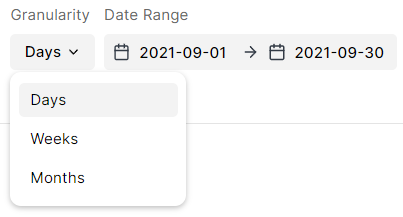
Example of both a date Granularity selection and a KPI Date Range selection.
Data AvailabilityMeasurement reports can return data for any available range of complete days, weeks, or months. For a date to be complete within the MAP system, both the DSP ad log data, as well as T-Mobile's proprietary 1st party mobile app engagement data, must be loaded and summarized into the MAP platform databases.
- Ongoing data availability for established campaigns and mobile apps is on a ~4-day lag.
- Newly added campaign or mobile app historic data is available every Monday.
- Historic data is available from July 1, 2021 forward.
Range
The Date Range selection filter works in conjunction with date grain selection filter. The KPI Date Range filter allows for selection of any dynamic start and end date by which to aggregate, average or trend data points.
The simplest way to utilize the KPI Date Range filter is to select "Campaign" in the drop down. Selecting "Campaign" tells the report to trim the date range of the report to the date of the first impression served through the date of the last impression served + the Impression Window.
For Example
If the campaign chosen in the Campaign filter has a first impression served date of 2022-06-13, and a last impression served date of 2022-06-30, and the impression Window chosen is 30 days, then by selecting the "Campaign" option from the KPI Date Range filter, the report will return data for the dates of 2022-06-13 through 2022-07-30.
The KPI Date Range filter also allows for the selection of "Custom". If "Custom" is selected, then two calendars will appear to be utilized in the selection of a custom KPI date range. The user may navigate to the appropriate dates using the calendar functionality or simply type in the start and end dates in manually. The KPI Date Range filter can accept most date formats that are manually entered.
Illogical & Allowable Date RangesIf "Custom" is chosen in the KPI Date Range filter, then certain rules are implemented to disallow illogical custom date ranges.
The range calendars will automatically grey out dates in either calendar that are not able to be selected. For example, if the beginning date of the selected range is Sept 10th, the calendar for the end date selection will not allow a date before Sept 10th to be picked. This mechanism prevents accidentally entering illogical date ranges during report set up.
Date range selection also cannot be made outside of the allowable ranges, which are bound by historic data availability and the ongoing finality of new data ingested.
Due to the dynamic nature of the KPI Date Range selection filter, in cases where the range of dates selected does not exactly conform to the date grain selected, the report will auto-correct the range to match the grain.

Pop up notification that an entered date range has been automatically adjusted to fit the selected date grain.
For Example: A user selects a date range of 2021-09-10 to 2021-09-21.
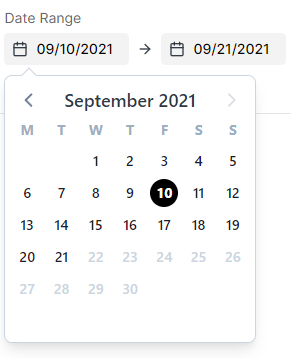
A dynamic, and arbitrary, date range selection.
The data reported back for this date range selection will be dependent on the date grain selected.
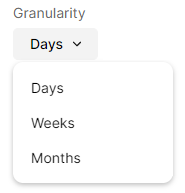
The date Granularity filter expanded to display all three (3) report date grouping options.
Daily
All data points for all days selected, Sept 10 - Sept 21 inclusive, will be utilized in the return data.
Weekly
The range will be automatically changed for you so that only full weeks (Monday - Sunday) are selected. In this example that would be data from the complete weeks of Sept 6 - Sept 12, Sept 13 - Sept 19, and Sept 20 - Sept 26.The automatic range adjustment always works to expand to include all possible full weeks based on your original arbitrary range selection.
Monthly
The range will be automatically changed for you so that only full months (1st Day of Month - Last Day of Month) are selected. In this example that would be data from one complete month of Sept 1 - Sept 30.The automatic range adjustment always works to expand to include all possible full months based on your original arbitrary range selection.
Weekly & Monthly Data CreationWithin Measurement reports, the data points returned are of two (2) varieties:
- Campaign Constrained KPI Data
- Total US Mobile KPI Data
In "Campaign Constrained KPI Data" it can often be the case that not all days in a given week or monthly data point have Campaign data, since campaigns do not always start and stop evenly on a week or month date bound. This means that when in weekly or monthly grain reporting mode, Measurement will utilize as many days in a given week or month as possible when constructing the Campaign KPI data point, but not all days will have campaign data to utilize.
This campaign-based exception is different than "Total US Mobile KPI Data", in which there are no arbitrary campaign activity dates to take into account, so all weeks and months will always have all days of data present within them.
For ExampleAssume that a given campaign was active between the dates of Monday June 13, 2022 and Thursday June 30, 2022. For this campaign, the following data will be created based on the date Granularity selected:
Days
- With "Days" selected as the date Granularity, all 18 active days of the campaign will be reported back individually. Each of these 18 days will be reported back in full as they all had active campaign data transmission occurring on them.
Weeks
With "Weeks" selected as the date Granularity, there will be three (3) Monday - Sunday seven-day weekly data points returned. Because the campaign began on a Monday (2022-06-13), the week of 6/13 will utilize a full seven (7) days of active campaign data, as will the week of 6/20. However, the third and final reported week of campaign data, that of 6/27, will only utilize the days of 6/27, 6/28, 6/29, and 6/30 because there was no campaign activity on 6/31, 7/1, and 7/2. The three days with no campaign activity will be treated as NULLs, meaning that they will not count into any campaign-based metric calculations.
However, if trending a "Total US Mobile KPI Data" metric next to the "Campaign Constrained KPI Data" metric, the "Total US Mobile KPI Data" metric will utilize all seven days in the week of 6/27, because it is not constrained by arbitrary campaign start and end dates. This means that when reviewing data in the final week of 6/27, one must take into account that "Campaign Constrained KPI Data" metric will be based on four (4) days of data, while the "Total US Mobile KPI Data" metric will be based on seven (7) days of data.
Months
With "Weeks" selected as the date Granularity, there will be a single (1) campaign data point returned, for the full 30 day month of June 2022. In the same way that weekly data is handled, this single month of campaign data will include only the days that the campaign was active: June 16 - June 30 (18 days out of 30 days in the month). The 12 days of the month for which there was no active campaign data the dates will be treated as NULL values and will not affect the overall calculations of the "Campaign Constrained KPI Data" metrics.
Similar to weekly date granularity, if a "Campaign Constrained KPI Data" metric is plotted next to a "Total US Mobile KPI Data" metric, the campaign metric may be (will be in this example) composed of fewer data points than the total US metric.
Window
The impression, or attribution, Window filter is available for finetuning any report to contract or expand the range of allowable devices for the KPI values returned in the report. The Impression Window is preset to 30 days, but will also allow for the selection of either 60 or 90 day windows.
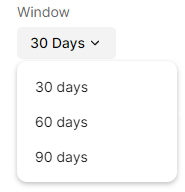
The impression Window filter expanded to display all three (3) report lookback options.
The Impression Window works by creating a lookback period of 30, 60 or 90 days previous to the day, week or month being reported. The lookback window will find all mobile devices that were served an impression from the given campaign during the period, and then investigate that pool of devices to determine which had KPI actions in the day, week, or month being reported.
Date Grain & Range + Window Example
To better understand how these three (3) filters work together, let's explore an example scenario. Assume that Google, as an Advertiser, ran a campaign to promote a new version of their browser Google Chrome. The Campaign was called "Google - 2022Q1 Chrome Adoption Campaign". This campaign ran from January 1st 2022 to January 15th 2022. Google would like to run a report to determine how many mobile devices that were exposed to an ad from this campaign later went on to install the Google Chrome browser app on their mobile devices.
Google decides to set up a User Acquisition report to retrieve this data. The User Acquisition report provides a KPI called Exposed Installs, which can inform Google of the number of mobile devices that installed the Google Chrome app after being exposed to an ad from the "Chrome Adoption" campaign.
The report parameters are set up as follows:

An example filter set up for the User Acquisition report.
The above report set up encompasses the known flight dates for the campaign, as well as sets the impression lookback window to 30 days.
When the above report is run, the data returned will show a daily trend of mobile devices that were both exposed to an ad from the "Chrome Adoption" campaign, as well as installed the Chrome app on their mobile device after being exposed to that ad.
The results will appear as such:
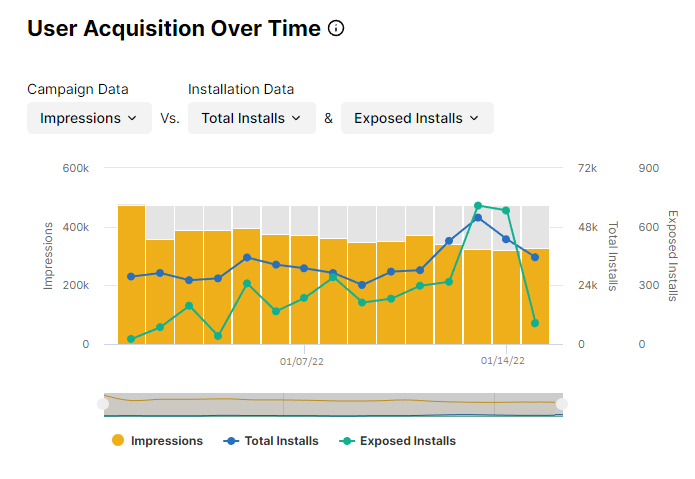
User Acquisition Over Time example report results.
In this time series graph, the KPI for Exposed Installs is trended at a daily grain between 2022-01-01 and 2022-01-15. Here is a breakdown of how these data are determined for presentation:
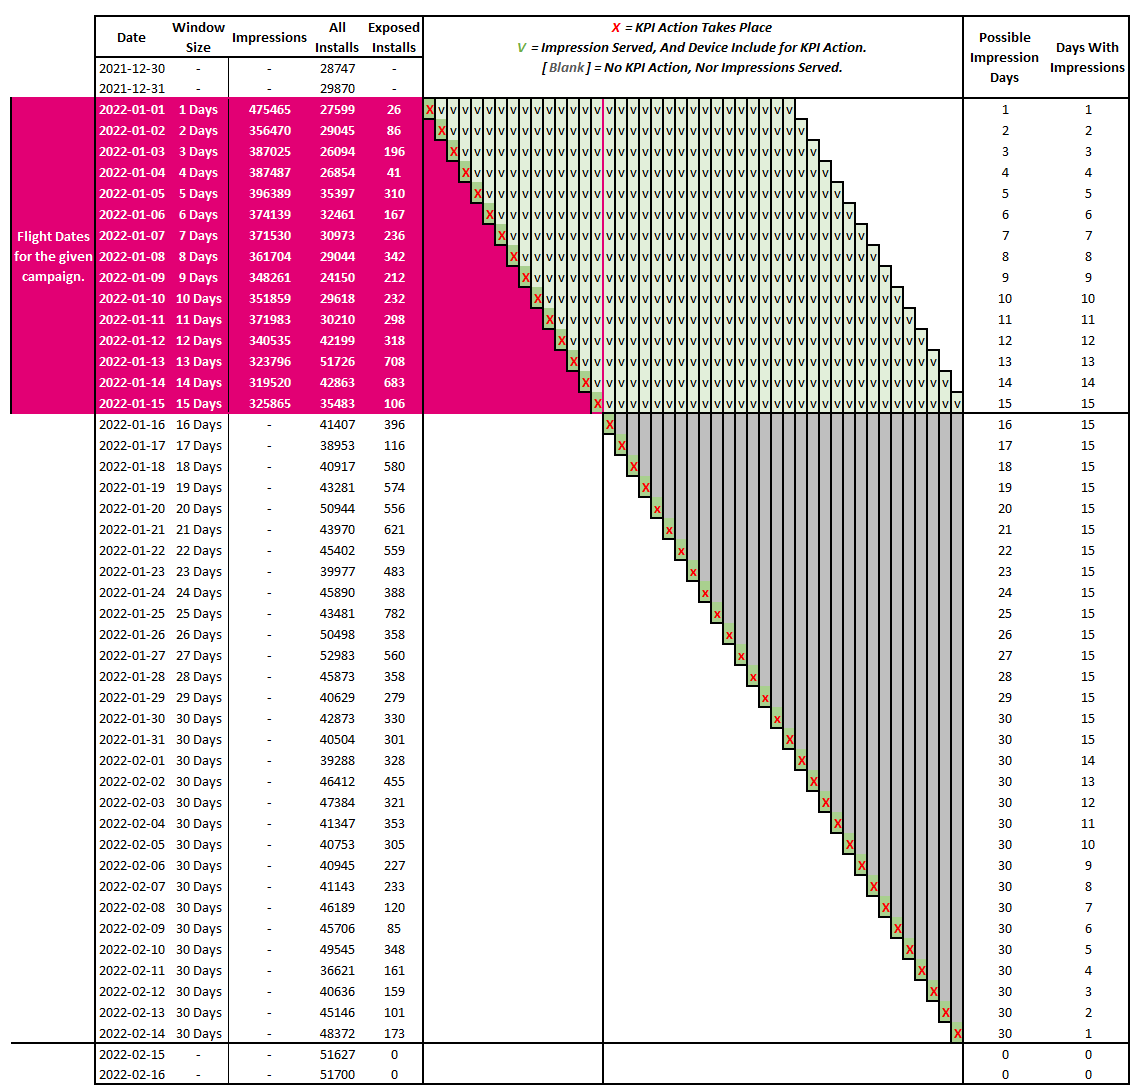
Example data structure for determining which devices that are served can contribute to a given KPI action in Measurement.
In the above data structure example it can be seen that the number of ad-exposed mobile devices that are allowed to contribute to the Exposed Installs KPI value grows as the campaign progresses through its flight dates. This is because of the 30 day Window functionality:
- On the first day of the report (campaign) only those devices that installed the app after being served an ad on that same date are counted as converted towards the KPI value.
- On the second day of the report (campaign) all devices that installed the app on day 2 after being served an ad on day 1 or day 2 are counted as converted towards the KPI value.
- By day 5 of the report (campaign) all devices that installed the app on day 5 after being served an ad on days 1, 2, 3, 4, or 5 are counted as converted towards the KPI value.
- By day 15 of the report (campaign) all devices that installed the app on day 15 after being served an ad on any days 1-15 are counted as converted towards the KPI value.
In a 15 day campaign with a 30 day lookback window, the maximum ad-exposed device pool is reached on report (campaign) days 15 through 30 (this is the range in which the maximum number of allowable ad-served devices are included as potential converted KPI devices). If this example report were to be run for a longer date range
No matter the report (campaign) day, the All KPI value (in this example, all devices installing regardless of ad exposure) is consistently trendable even outside of the campaign flight dates since it has no reliance on ad exposure to create its device pool (its device pool is a constant US Mobile Device Universe, not the changing universe of ad-exposed devices).
Updated 10 months ago
